Your reps sent 4,000 emails last month, the CRM shows 600 new leads, and the quarter still closed 30% short. Nobody can say which stage broke. That is what happens when activity gets tracked and pipeline data does not.
Here is the short answer. Pick six to eight KPIs that follow a deal from first contact to closed revenue, set a baseline from your own history, and review them weekly against quota. Then fix the stage where the most opportunities drop out. The sections below give the formulas, the steps, and the mistakes that skew the numbers.
Why Are B2B Sales Teams Missing Revenue Targets Despite High Prospecting and Outreach Activity?
Activity counts effort, not progress. Emails sent and calls made say nothing about how many buyers moved closer to a signature.
The gap between sales activities, qualified opportunities, and closed revenue
A rep can book 40 calls and create zero qualified opportunities. Revenue follows opportunities that meet your qualification bar, so measure the handoff between steps, not the volume at the top.
Why high lead volumes and outreach numbers do not guarantee sales growth
More leads stretch rep attention thin. If contacts are wrong or off-ICP, extra volume raises bounces and lowers reply rates, which drags every number downstream.
How disconnected prospecting, outreach, and CRM data affect sales performance
When prospecting, outreach, and deals sit in three tools, nobody can trace a closed deal back to its source. Reports disagree, and managers argue about definitions instead of fixing stages.
The role of B2B sales KPIs and pipeline data in identifying revenue gaps
KPIs make a vague miss specific. "Win rate fell from 24% to 17% in mid-market" beats "reps need to push harder." Pipeline data shows where the gap opens.
What Is a B2B Sales Strategy and How Do KPIs Measure Its Success?
A B2B sales strategy is your plan for which accounts to target, how to reach them, and how to win them. KPIs show whether each part of that plan produces revenue at the rate you expected.
The connection between sales objectives, revenue targets, and sales strategy KPIs
Start from the revenue target and work backward. A $2M quota with a $20K average deal needs 100 wins, which sets the opportunities, leads, and outreach volume you need at current conversion rates.
Leading and lagging indicators in B2B sales performance measurement
Leading indicators (qualified leads, replies, meetings booked) move first and can be fixed in days. Lagging indicators (win rate, revenue, quota attainment) confirm results weeks or months later.
Sales metrics vs. sales KPIs: Understanding the difference
A metric is any number you can count. A KPI is a metric tied to a target and a decision. Emails sent is a metric. Reply-to-meeting rate against a 25% goal is a KPI.
How sales pipeline data connects daily activities with revenue outcomes
Pipeline data records each deal's stage, value, age, and source. It links daily work to revenue by showing which activities produce deals that reach later stages.
Which B2B Sales Metrics Matter at Each Stage of the Sales Funnel?
Track one or two metrics per stage, and make sure each one feeds the next.
Prospecting metrics: Contact discovery, outreach volume, and engagement
Track contacts found, verified-email rate, touches sent across email and LinkedIn, and reply rate. Verified-email rate comes first, since a high bounce rate corrupts the reply data.
Lead qualification metrics: Qualified leads and lead-to-opportunity conversion rate
These show whether outreach reaches buyers who fit your ICP. A rising lead count with a flat conversion rate means targeting has drifted.
Opportunity metrics: Pipeline value, deal progression, and stage conversion
Pipeline value, stage-to-stage conversion, and days in stage show whether deals move or sit.
Closing metrics: Win rate, average deal size, and sales cycle length
These three show how efficiently you turn opportunities into revenue. Watch them as a set, since a higher win rate bought with heavy discounting shrinks deal size.
Revenue metrics: Quota attainment, revenue growth, and customer acquisition cost
These show whether the whole system pays for itself. Quota attainment measures output, and customer acquisition cost measures what that output cost.
What Are the Best B2B Sales KPIs to Track With Formulas?
These eight cover the full path from lead to revenue. Each one answers a single question.
Lead-to-opportunity conversion rate: Measuring lead quality
Formula: (Opportunities created ÷ Leads) × 100. A low rate points to weak targeting or loose qualification.
Sales win rate: Measuring the percentage of opportunities closed
Formula: (Closed-won deals ÷ Opportunities that reached a final outcome) × 100. Leave open deals out of the denominator.
Sales pipeline velocity: Measuring how quickly opportunities generate revenue
Formula: (Opportunities × Average deal size × Win rate) ÷ Sales cycle length in days. The result is expected revenue per day, so any lever you improve raises it.
Pipeline coverage ratio: Comparing open opportunities with revenue targets
Formula: Open pipeline value ÷ Remaining quota. The 3x to 4x rule of thumb is just 1 ÷ win rate, so a team winning 25% needs 4x. Count only deals under 1.5 times your median cycle age, since aged deals inflate the ratio.
Average deal size: Measuring revenue generated per closed deal
Formula: Closed-won revenue ÷ Number of closed-won deals. Track it by segment, as one blended number hides which accounts pay best.
Sales cycle length: Measuring the time required to close deals
Formula: Total days from opportunity creation to close ÷ Number of won deals. Measure won deals only, or lost deals will distort it.
Sales quota attainment: Measuring individual and team target achievement
Formula: (Revenue closed ÷ Quota) × 100. Report it per rep and per team, so one star performer cannot hide a weak team.
Customer acquisition cost: Measuring the cost of acquiring new customers
Formula: Sales and marketing spend in the period ÷ New customers won. Compare it with deal size and retention to judge whether growth is profitable.
How to Measure B2B Sales Performance Using KPIs and Pipeline Data
Work through seven steps in order. Skipping the baseline is the most common reason teams misread their numbers.
Step 1: Define sales objectives and measurable revenue targets
Set a revenue number and a date. If the plan itself needs work, build a B2B sales strategy first, then attach KPIs to it.
Step 2: Select KPIs based on your sales funnel and business model
Short cycles with high volume need activity and conversion KPIs. Long enterprise cycles need coverage, stage duration, and deal size.
Step 3: Establish baseline performance using historical sales data
Use at least two full sales cycles of data. Drop one-off quarters, such as a single outsized partner deal, so the baseline reflects normal performance.
Step 4: Track prospecting activities and qualified lead generation
Log touches by channel and count qualified leads, not raw contacts. Tag every lead with its source so you can trace it later.
Step 5: Measure conversion rates across pipeline stages
Calculate the percentage of deals moving from each stage to the next. Review the trend, not a single week.
Step 6: Compare pipeline value with sales forecasts and revenue targets
Set weighted pipeline against the quota for the next 90 days. A shortfall now needs lead generation started today.
Step 7: Review individual, team, and overall sales performance
Compare reps against the team baseline on the same KPIs. Coach on the stage where a rep lags, not on total output.
How to Analyze B2B Sales Pipeline Data and Identify Revenue Bottlenecks
Compare each stage with your baseline, find the steepest drop, then inspect the deals inside it.
Analyze conversion rates to find where opportunities drop out
Calculate stage-to-stage conversion for the last two quarters. The stage furthest below baseline is your first bottleneck.
Identify stalled deals using stage duration and deal progression data
Flag any deal that sits in a stage longer than 1.5 times your median days-in-stage. These deals rarely close, and they inflate pipeline value.
Compare pipeline coverage against upcoming sales quotas
A coverage gap today becomes a missed quarter later, because outbound takes weeks to refill. Check it monthly against the next two quarters.
Examine win rates across lead sources, industries, and customer segments
Split win rate by source, industry, and company size. One source can win at twice the rate of another, and that tells you where to aim outreach.
Identify sales cycle delays caused by follow-ups and qualification gaps
Look at the wait between a reply and the first meeting. Slow follow-up adds days to every deal that passes through.
Use historical pipeline trends to improve revenue forecasting
Plot four to six quarters of conversion and cycle length. Seasonal patterns appear, and forecasts stop depending on rep optimism.
How to Improve B2B Sales Strategy Using KPIs and Performance Data
Fix the weakest KPI first, using the data that explains it: lead quality for conversion, engagement for outreach, follow-up speed for leakage.
Improve prospect targeting using lead quality and conversion data
If lead-to-opportunity conversion is low, tighten the ICP. Lead Explorer searches 840M+ profiles in plain English or with stacked filters for industry, role, seniority, company size, tech stack, and Intent Topics. Run your best-converting segment through it and compare that list with your current one.
Optimize email and LinkedIn outreach using engagement metrics
Judge sequences on reply-to-meeting rate by step, not open rate. A 12% reply rate that never becomes meetings is noise. Unibox sorts replies into Interested, Follow-Up, and Not a Fit, so you count real interest instead of auto-replies.
Improve lead qualification using buyer intent and ICP criteria
Score leads on ICP fit plus buying signals. Salestarget.ai pairs Bombora Intent Topics with business events such as funding rounds, hiring spikes, and leadership changes on a 30 to 90 day lookback.
Reduce pipeline leakage through timely follow-ups and deal tracking
Leakage is mostly forgotten replies. The built-in CRM creates follow-up tasks automatically when a lead replies or a meeting ends, and Salestarget.ai reports 91% follow-up completion.
Improve sales productivity by reducing manual prospecting and CRM tasks
Salesforce's State of Sales research puts selling time at roughly 30% of a rep's week in recent editions. Salestarget.ai reports about six hours saved per rep per week from automatic logging and enrichment.
Adjust sales targets and resource allocation using pipeline performance
If coverage is 2x and win rate is 25%, you need 4x. Raise pipeline or lower the target. Move headcount and budget toward segments with the highest win rate and shortest cycle.
How to Build a B2B Sales KPI Dashboard for Better Performance Tracking
Build two views from one data source: an executive view for outcomes and a rep view for daily action.
Choose the right sales metrics for executive and rep-level dashboards
Executives need quota attainment, coverage, win rate, velocity, and CAC. Reps need replies, meetings booked, opportunities created, and overdue tasks.
Connect CRM records, outreach activities, and pipeline data
A dashboard is only as good as the data under it. In the Salestarget.ai CRM, campaign leads land automatically with no imports, and every email and call is logged to the lead timeline. Open the Reports & Analytics module to see email stats, open deals, meetings, and pending tasks in one live pipeline.
Track leading and lagging indicators in one reporting system
Put reply-to-meeting rate next to win rate on the same screen. When the leading number slips, you see the lagging one before it drops.
Set weekly, monthly, and quarterly sales performance reviews
Weekly: leading indicators and overdue tasks. Monthly: stage conversion and cycle length. Quarterly: CAC, segment win rates, and targets.
Use KPI trends to make sales strategy and forecasting decisions
Three straight weeks of falling reply-to-meeting rate is a signal. Change the message or the list before the quarter ends, not after.
Common B2B Sales KPI Measurement Mistakes That Affect Revenue Decisions
Most bad decisions trace back to one of these six errors.
Tracking outreach volume without measuring qualified lead conversion
Volume goals reward sending, not selling. Pair every volume target with a conversion target.
Using inconsistent KPI definitions across sales teams
If one team counts an opportunity at first reply and another after a discovery call, comparisons are meaningless. Write the definitions down and apply them everywhere.
Counting unqualified opportunities as active pipeline value
Inflated pipeline hides a coverage problem until the quarter is lost. Require clear entry criteria for each stage.
Ignoring lost deals, stalled opportunities, and sales cycle delays
Lost deals hold the best data on objections and competitors. Log a loss reason every time.
Using outdated CRM records for pipeline reporting
Stale stages and missing activity make every report wrong. Automatic logging beats relying on reps to update records.
Applying generic sales benchmarks without considering deal size and sales cycles
A benchmark from a $5K deal says little about a $150K deal. Benchmark against your own baseline first.
What Should You Look for in a B2B Sales Performance Tracking Platform?
Look for one platform that records every step from contact discovery to closed deal without manual entry.
Accurate B2B contact data and lead enrichment
Bad contacts distort conversion math. Check that enrichment happens when you find the lead and that emails are verified at that point.
Email and LinkedIn outreach activity tracking
Both channels should report into one view, so you can tell which touch produced the meeting.
Email verification and deliverability monitoring
Bounces lower reply rates and hurt sender reputation. Look for pre-send verification and checks on SPF, DKIM, and DMARC.
CRM pipeline visibility and automatic sales activity logging
Logging should happen on its own. Manual updates produce gaps, and gaps produce wrong KPIs.
AI-powered prospecting, sales reporting, and workflow assistance
An assistant that answers pipeline questions in plain language saves analysts and managers hours each week.
Why Choose SalesTarget.ai
Salestarget.ai keeps prospecting, outreach, validation, and CRM in one workspace, so every KPI above comes from the same data.
Find and enrich B2B prospects using Lead Explorer's 840M+ verified profiles
Lead Explorer covers 840M+ professional profiles, 146M+ business entities, and 4,000+ intent signals across 50+ data sources. One-click enrichment unlocks verified emails and phone numbers, and Salestarget.ai reports 99% verified contact data.
Run AI-powered email sequences with automated inbox warm-up and Unibox
Email Outreach builds multi-step sequences from a plain-English audience description, with unlimited inboxes, automatic AI warm-up, and inbox rotation. Unibox pulls every reply into one view and syncs deals to the CRM.
Manage LinkedIn and email outreach through one connected workflow
LinkedIn Outreach automates connection requests, DMs, and follow-ups, with conditional sequences that branch on replies. Rate limits and auto-pause safeguards protect the account, and context carries across both channels.
Reduce email bounces with MX and SMTP email validation
The Email Validator checks MX and SMTP records, detects disposable addresses, and scores risk. Salestarget.ai reports 90% of emails validated before sending, which keeps reply-rate data clean.
Track opportunities using a built-in CRM with automatic activity logging and AI Dialer
Leads arrive from campaigns without imports, and the AI Dialer logs calls automatically. Salestarget.ai reports 3.2X faster deal cycles and 2.4X more meetings from the same leads.
Use the free AI Copilot for prospecting, sequence creation, and CRM insights
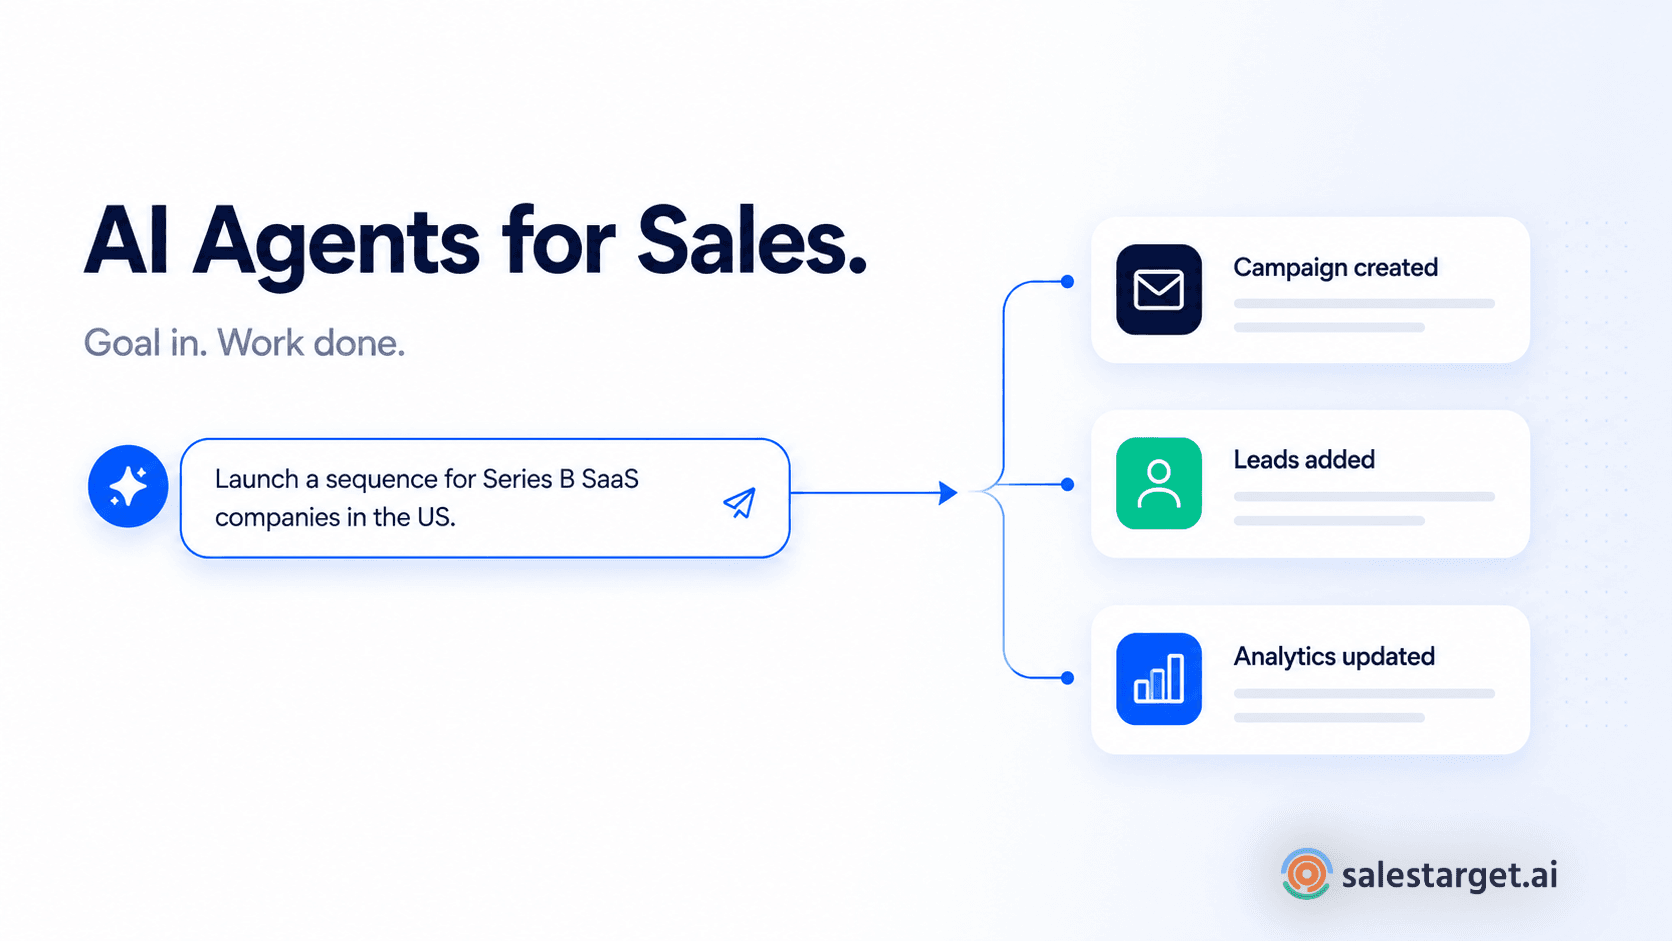
Ask the AI Copilot which campaigns drive revenue, which deals are at risk, or to draft a full sequence. It queries your CRM in plain language and recommends the next move, while strategy stays with you.
Build a Data-Driven B2B Sales Strategy With the Right KPIs
The opening problem was activity without answers. The fix is a short KPI set, a clean baseline, and one system where prospecting, outreach, and deals feed the same numbers. Salestarget.ai gives you that system, so you see which stage leaks and what to change.
Start with your weakest KPI and trace it to its source. Then start free with Salestarget.ai and see your pipeline in one place.