TL;DR
- LinkedIn outreach analytics track different signals than email — acceptance rate, reply rate, and positive reply rate tell three completely different stories about your campaign health.
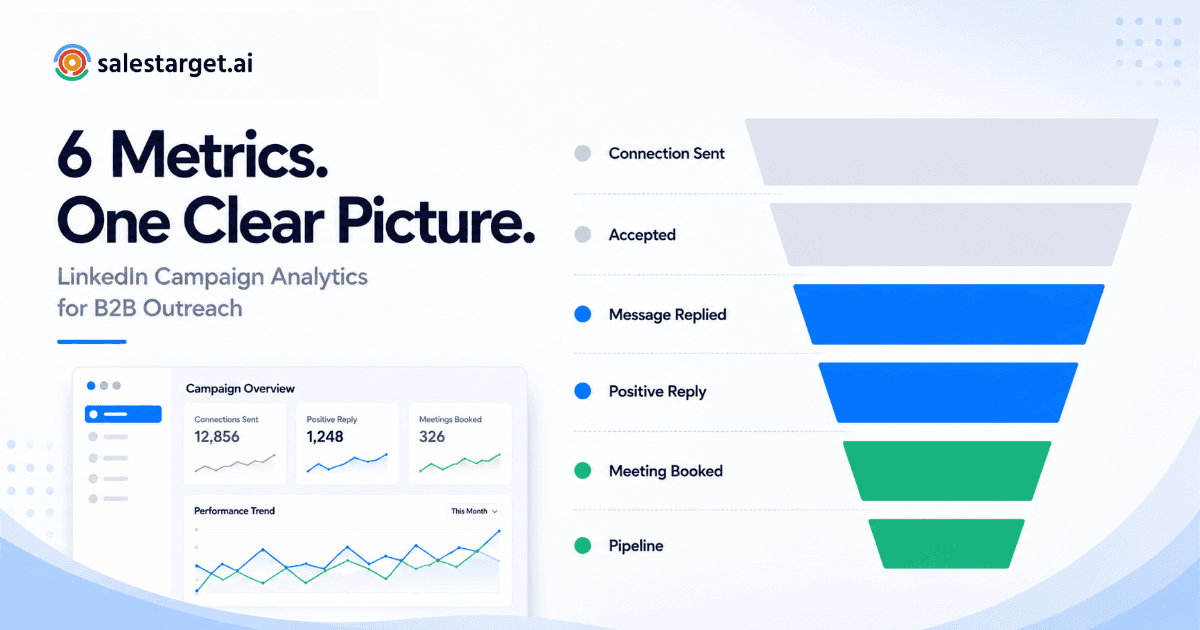
- Six metrics matter: connection acceptance rate, reply rate, positive reply rate, meeting booked rate, sequence completion rate, and SSI score.
- Most teams only track reply rate. That is like reading only one line of a lab report and declaring yourself healthy.
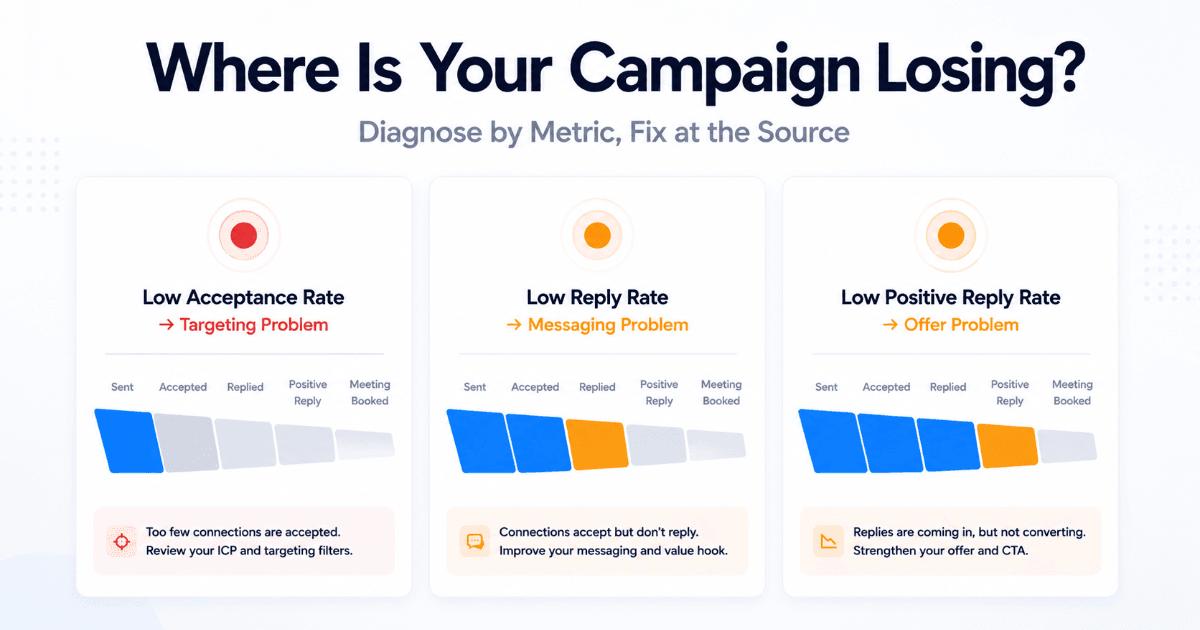
- Each metric diagnoses a different failure point — low acceptance rate is a targeting problem, low reply rate is a messaging problem, low positive reply rate is a relevance problem.
- SalesTarget's LinkedIn Analytics & CRM dashboard surfaces all six metrics and connects them directly to your pipeline.
Most SDRs check one number after a LinkedIn campaign — reply rate — decide it is good or bad, and move on. That single metric tells you almost nothing useful. It does not tell you whether your targeting is off, your messaging is wrong, your sequence is too short, or your prospects are replying with hard nos. LinkedIn campaign analytics only work when you know which metrics to read, in which order, and what each one is actually diagnosing.
Why LinkedIn Outreach Analytics Are Different From Email Analytics
Email analytics are binary at the top of the funnel: delivered or not, opened or not. LinkedIn introduces a step that email does not have — the connection request. Before a single message is read, your prospect has already made a decision about you based on your profile, your headline, and your connection note.
That extra step means your LinkedIn outreach analytics have to track a two-stage funnel before you even get to reply rate. A prospect who ignores your connection request never sees your message. So if your acceptance rate is poor, your reply rate data is built on a fraction of your target list — and any conclusions you draw from it are unreliable.
There is also a quality dimension that email lacks. In email, a reply is a reply. On LinkedIn, replies span a spectrum: genuine interest, a polite no, a referral to someone else, or a hostile response asking to be removed. Tracking raw reply rate without tracking positive reply rate gives you an inflated picture of campaign health that does not survive contact with your actual pipeline.
The practical implication: LinkedIn campaign analytics require more metrics, read in a specific sequence, to tell you anything actionable.
The 6 Metrics That Actually Matter in LinkedIn Campaign Analytics
These six metrics form a diagnostic stack. Read them top to bottom and each one narrows down where your campaign is losing performance.
| # | Metric | What It Measures | What It Diagnoses |
|---|---|---|---|
| 1 | Connection Acceptance Rate | % of connection requests accepted | Targeting quality and profile strength |
| 2 | Reply Rate | % of sent messages that received any reply | Message relevance and sequence structure |
| 3 | Positive Reply Rate | % of replies expressing genuine interest | Offer relevance and ICP fit |
| 4 | Meeting Booked Rate | % of positive replies that convert to a booked call | SDR follow-up speed and qualification messaging |
| 5 | Sequence Completion Rate | % of prospects who received every step in the sequence | Sequence length fit and drop-off points |
| 6 | SSI Score | LinkedIn's Social Selling Index — a 0–100 score across four pillars | Profile authority and network health over time |
A note on SSI: this is a LinkedIn-native metric, visible directly in your LinkedIn account. It is not a campaign-level metric — it moves slowly and reflects your long-term profile activity, content engagement, and network quality. Track it monthly as a health indicator, not weekly as a campaign signal.
2026 Benchmarks: What Good Looks Like for Each Metric
Benchmarks in B2B LinkedIn outreach vary by industry, seniority level, and sequence quality. The ranges below reflect what well-run outreach programs targeting mid-market and enterprise B2B SaaS buyers typically achieve, based on data from LinkedIn outreach platforms and multi-campaign analysis.
| Metric | Below Average | Average | Strong |
|---|---|---|---|
| Connection Acceptance Rate | Under 20% | 20–30% | 30–45%+ |
| Reply Rate | Under 10% | 10–20% | 20–35%+ |
| Positive Reply Rate | Under 5% | 5–12% | 12–20%+ |
| Meeting Booked Rate | Under 15% of positive replies | 15–30% | 30–50%+ |
| Sequence Completion Rate | Under 60% | 60–75% | 75–90%+ |
| SSI Score | Under 50 | 50–65 | 65–80+ |
📊 On Benchmarks and Context
- Industry matters — Fintech and enterprise software ICPs accept connections and reply at lower rates than SMB SaaS or agency targets. Adjust your expectations by segment.
- Seniority matters — C-suite and VP-level prospects have lower acceptance rates but higher meeting conversion when they do engage. Director and manager-level targets tend to have higher reply rates but lower conversion.
- Your own trend matters most — Compare your current campaign against your last three campaigns before comparing against industry benchmarks. Directional improvement in your own data is the most reliable signal.
How to Diagnose Poor Performance From the Data
The six metrics form a diagnostic sequence. When performance is poor, the location of the drop-off tells you exactly what to fix — and what not to touch.
Low Connection Acceptance Rate
Targeting or profile problem — not a messaging problem
If fewer than 20% of your requests are being accepted, your list quality or your LinkedIn profile is the issue. Review your ICP filters — are you reaching the right seniority, company size, and industry? Then audit your profile: headline, banner, recent activity. Prospects check your profile before accepting. A sparse or generic profile kills acceptance rate before your message is ever read.
Good Acceptance Rate, Low Reply Rate
Messaging problem — targeting is working, copy is not
Your ICP is right — prospects are accepting. But your follow-up messages are not landing. Common causes: too much about your product, not enough about their problem; opening line that reads like every other outreach message they receive; CTA that asks for too much too soon. Rewrite your first follow-up message before touching anything else in the sequence.
Good Reply Rate, Low Positive Reply Rate
Offer or relevance problem — people are engaging but not interested
Replies are coming in but they are mostly polite declines, unsubscribes, or misdirected responses. This is an offer-fit or timing problem. Your message is generating a reaction but not the right one. Review your value proposition — is it specific to their role and their likely pain points right now? Generic offers generate generic rejections.
Good Positive Reply Rate, Low Meeting Booked Rate
Follow-up speed or qualification problem
Prospects are expressing interest but not converting to booked calls. This is almost always a follow-up speed issue — SDRs responding hours or days after a positive reply lose momentum. Salesforce research consistently shows that response time within the first hour of a positive signal dramatically increases conversion to meeting. The second cause is qualification messaging that creates friction rather than reducing it: overly complex Calendly flows, asking too many qualifying questions before offering a time.
How to Connect LinkedIn Analytics to Your CRM in SalesTarget
Campaign analytics tell you what happened in the sequence. CRM data tells you what happened after — whether positive replies turned into pipeline, whether pipeline turned into closed deals. The gap between those two data sets is where most outreach teams lose visibility.
SalesTarget bridges that gap by connecting your LinkedIn campaign analytics directly to your CRM records. Here is how to use that connection deliberately.
-
Review campaign performance in the LinkedIn Analytics dashboard
Start with your six-metric stack for the completed or in-flight campaign. Identify which metric is underperforming relative to your last campaign or the benchmarks above. This tells you where the fix needs to happen before you touch anything else. -
Cross-reference positive replies against CRM contact records
Every prospect who replied positively should have a corresponding contact record in SalesTarget's CRM. Check that activity is being logged automatically — LinkedIn message sent, reply received, positive signal flagged. If records are incomplete, your pipeline visibility is broken at the source. -
Move positive replies into the deal pipeline immediately
Do not leave positive replies sitting in your LinkedIn inbox as unstructured conversations. Create a deal record in SalesTarget's deal pipeline the moment a prospect expresses interest. Assign a stage, an owner, and a next action. This is where campaign analytics becomes revenue data. -
Track sequence-to-pipeline conversion rate over time
The metric most teams never calculate: of every 100 prospects who entered a LinkedIn sequence, how many became active pipeline opportunities? Calculate this for each campaign and track the trend. It is the single number that tells you whether your LinkedIn outreach is actually generating revenue-stage activity or just generating conversations. -
Use CRM analytics to close the feedback loop
After each campaign cycle, look at which ICP segments, message variants, and sequence structures produced the highest sequence-to-pipeline conversion — not just the highest reply rate. Feed those learnings back into your next campaign's targeting and copy. This is how LinkedIn outreach compounds over time rather than plateauing after the first few campaigns.
Three Analytics Mistakes That Keep Outreach Teams Stuck
Mistake 1: Optimizing for Reply Rate Instead of Positive Reply Rate
The problem
Reply rate is a vanity metric on its own. A provocative or controversial opening message will generate a high reply rate — mostly negative replies. If you optimize your sequence for total reply rate without filtering for sentiment, you will write increasingly aggressive messages that generate more noise and less pipeline. Positive reply rate is the metric that connects to revenue. Optimize for that.
Mistake 2: Reviewing Analytics After the Campaign Ends
The problem
Waiting until a campaign is complete to look at performance data means you have already burned your full prospect list on a broken sequence. Check your acceptance rate after the first 50 connection requests. If it is below 15%, pause and fix your targeting or profile before sending to the remaining list. Check your reply rate after the first 30 follow-up messages. Early signals are reliable enough to act on — you do not need to wait for statistical significance to make obvious fixes. Use SalesTarget's LinkedIn Analytics dashboard to monitor in-flight campaigns, not just completed ones.
Mistake 3: Treating All Campaigns as Comparable
The problem
Averaging performance across campaigns targeting different ICPs, seniority levels, and industries produces meaningless numbers. A campaign targeting Series A founders will have very different acceptance and reply rates than one targeting VP Sales at 200-person companies — not because one sequence is better than the other, but because the audiences behave differently. Segment your analytics by ICP, campaign type, and sequence before drawing any conclusions about what is working.
For a broader framework on using AI to analyze campaign performance across channels, see the SalesTarget guide to analyzing campaign performance using AI. For the full playbook on building LinkedIn sequences that generate consistent pipeline, see LinkedIn campaign management: how to build outbound sequences that convert.
Stop Guessing. Start Reading Your LinkedIn Data Correctly.
SalesTarget's LinkedIn Analytics & CRM dashboard gives you all six metrics in one view — connected directly to your pipeline so you know exactly where your outreach is winning and where it is leaking.
✓ 50 credits ✓ 7-day trial ✓ No credit card required